
How to Build Custom Social Media Dashboards
How to Build Custom Social Media Dashboards
How to Build Custom Social Media Dashboards
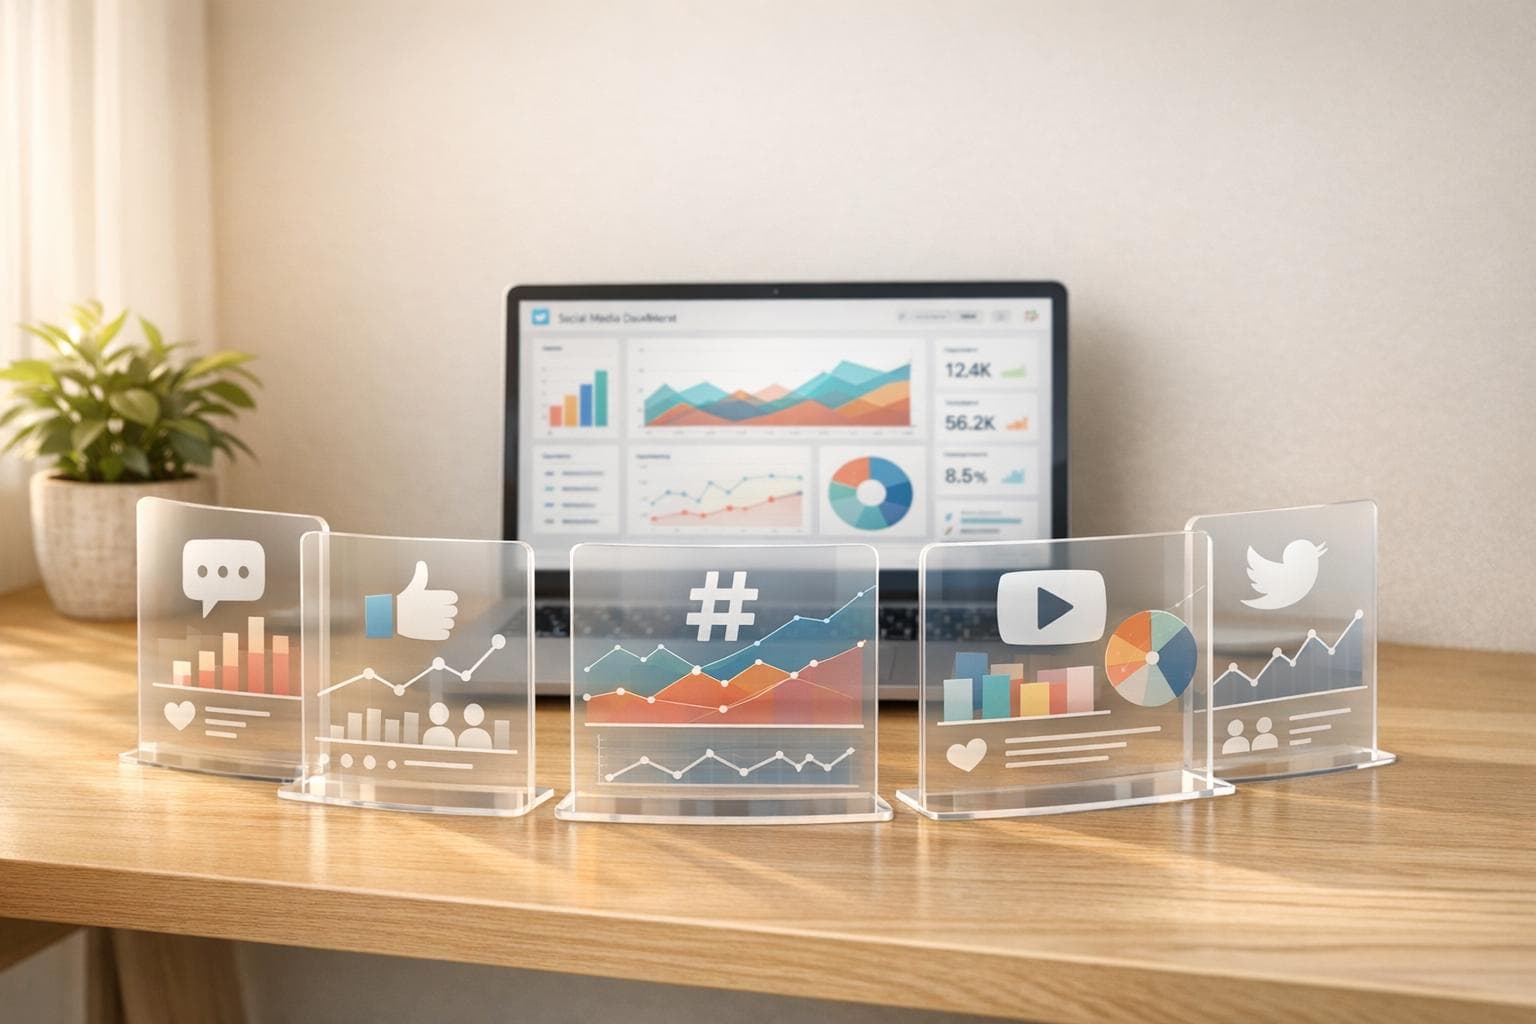
Managing social media performance across multiple platforms can be overwhelming. Custom dashboards simplify this by centralising key metrics into one view, saving time and improving decision-making. Instead of juggling Instagram, TikTok, LinkedIn, and Facebook analytics separately, you can track performance efficiently in one place. Here’s how:
- Set Goals and Metrics: Define clear objectives for each platform (e.g., brand awareness, lead generation) and focus on actionable KPIs like engagement rates, click-through rates, and sentiment analysis.
- Connect Accounts Securely: Use tools like Posterly to integrate platforms via official APIs, ensuring real-time data updates.
- Organise Your Dashboard: Customise layouts to prioritise key metrics, use visualisations like charts and tables, and create separate views for campaigns or platforms.
- Automate Updates: Save hours by setting up auto-refresh and scheduling reports to keep your data current.
- Refine Continuously: Regularly update dashboards to align with changing goals and identify trends for better decisions.
With tools like Posterly, you can integrate data from over 10 platforms, automate reporting, and improve workflow efficiency - all while focusing on metrics that drive results.
::: @figure 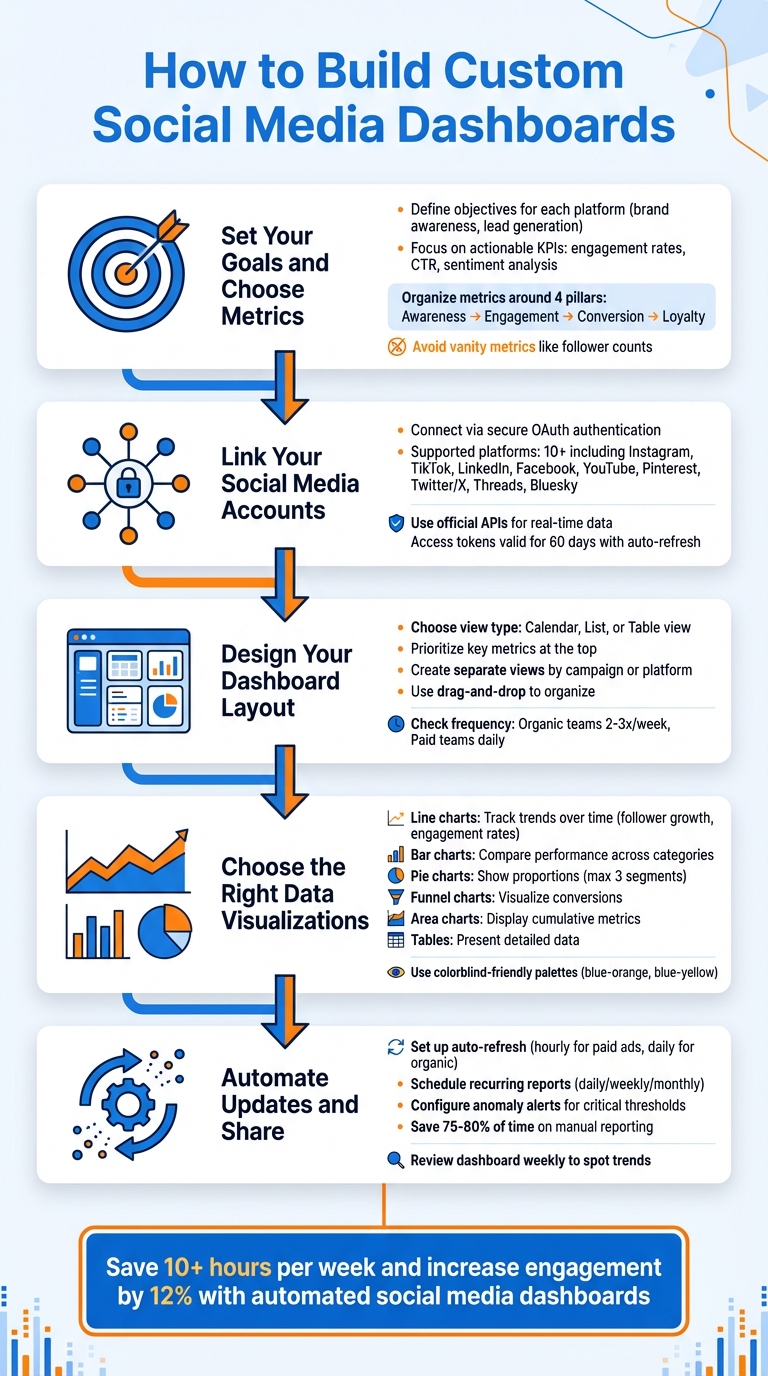 {5-Step Process to Build Custom Social Media Dashboards}
:::
{5-Step Process to Build Custom Social Media Dashboards}
:::
Build a Social Media Performance Dashboard in 2 Minutes with AI - Bricks Tutorial
::: @iframe https://www.youtube.com/embed/bKLz9n0Qky0 :::
Step 1: Set Your Goals and Choose Metrics
Before diving into adding widgets, take a step back and define your objectives. It’s crucial to distinguish between metrics and KPIs to track data that truly impacts your business growth [7]. Without clear goals, it’s easy to get overwhelmed by flashy numbers that might look good but don’t actually contribute to your success. Setting clear objectives ensures your dashboard delivers actionable insights.
Set Goals for Each Platform
Each social media platform has its own strengths, so your goals should align with what each one offers. For example, Instagram might be your go-to for building brand awareness among younger audiences, while LinkedIn could focus on establishing B2B credibility and generating serious leads. TikTok is perfect for experimenting with creative content formats, and Facebook might work best for fostering community engagement and retaining customers.
The type of engagement also varies by platform. A LinkedIn share from a professional carries a different significance than an Instagram save, which indicates someone found your content valuable enough to revisit later [6]. As Hailley Griffis, Head of Communications and Content at Buffer, explains:
"Different communities and social networks will engage differently, but if you are reaching an increased number of people, then you're doing something right." [7]
Pick Metrics That Drive Action
Once your goals are clear, focus on metrics that directly measure progress toward them. Vanity metrics, like follower counts, might look impressive but often fail to reflect real business impact. A smaller, highly engaged audience that converts is far more valuable than a massive, passive following [6]. Meryoli Arias, Head of Social Media at Glide, shared her insight after a post went viral with 2 million impressions but didn’t lead to sign-ups:
"I learned that virality is not and should never be the goal of social media. A good tap in the shoulder for the ego does not equal business success." [7]
Instead, prioritise KPIs that drive results. For brand awareness campaigns, focus on metrics like reach, impressions, and audience growth rate. If lead generation is your goal, track click-through rates (CTR), conversion rates, and cost per lead. Launching a product? Keep an eye on engagement rates, brand mentions, and sentiment analysis to gauge how the market responds [7][6]. On TikTok, average watch time is crucial - it signals to the algorithm that your content deserves a wider audience [6][9]. On LinkedIn, meaningful comments and insights into visitor demographics (like job function, seniority, and industry) are essential for building B2B authority [7][6].
Organise your metrics around the customer journey using these four pillars: Awareness (reach and impressions), Engagement (comments and shares), Conversion (CTR and sales), and Loyalty (mentions and sentiment) [6]. By aligning your metrics with real business outcomes, you can confidently prove ROI and make smarter, data-driven decisions about where to focus your efforts and budget.
Step 2: Link Your Social Media Accounts
To streamline your workflow and centralise performance data, connect your social media accounts to Posterly. This step turns your dashboard into a hub for real-time insights, using secure OAuth authentication. Rest assured, Posterly doesn’t store your login credentials; all connections are made via official APIs, adhering to each platform’s privacy policies.
How to Connect Platforms in Posterly
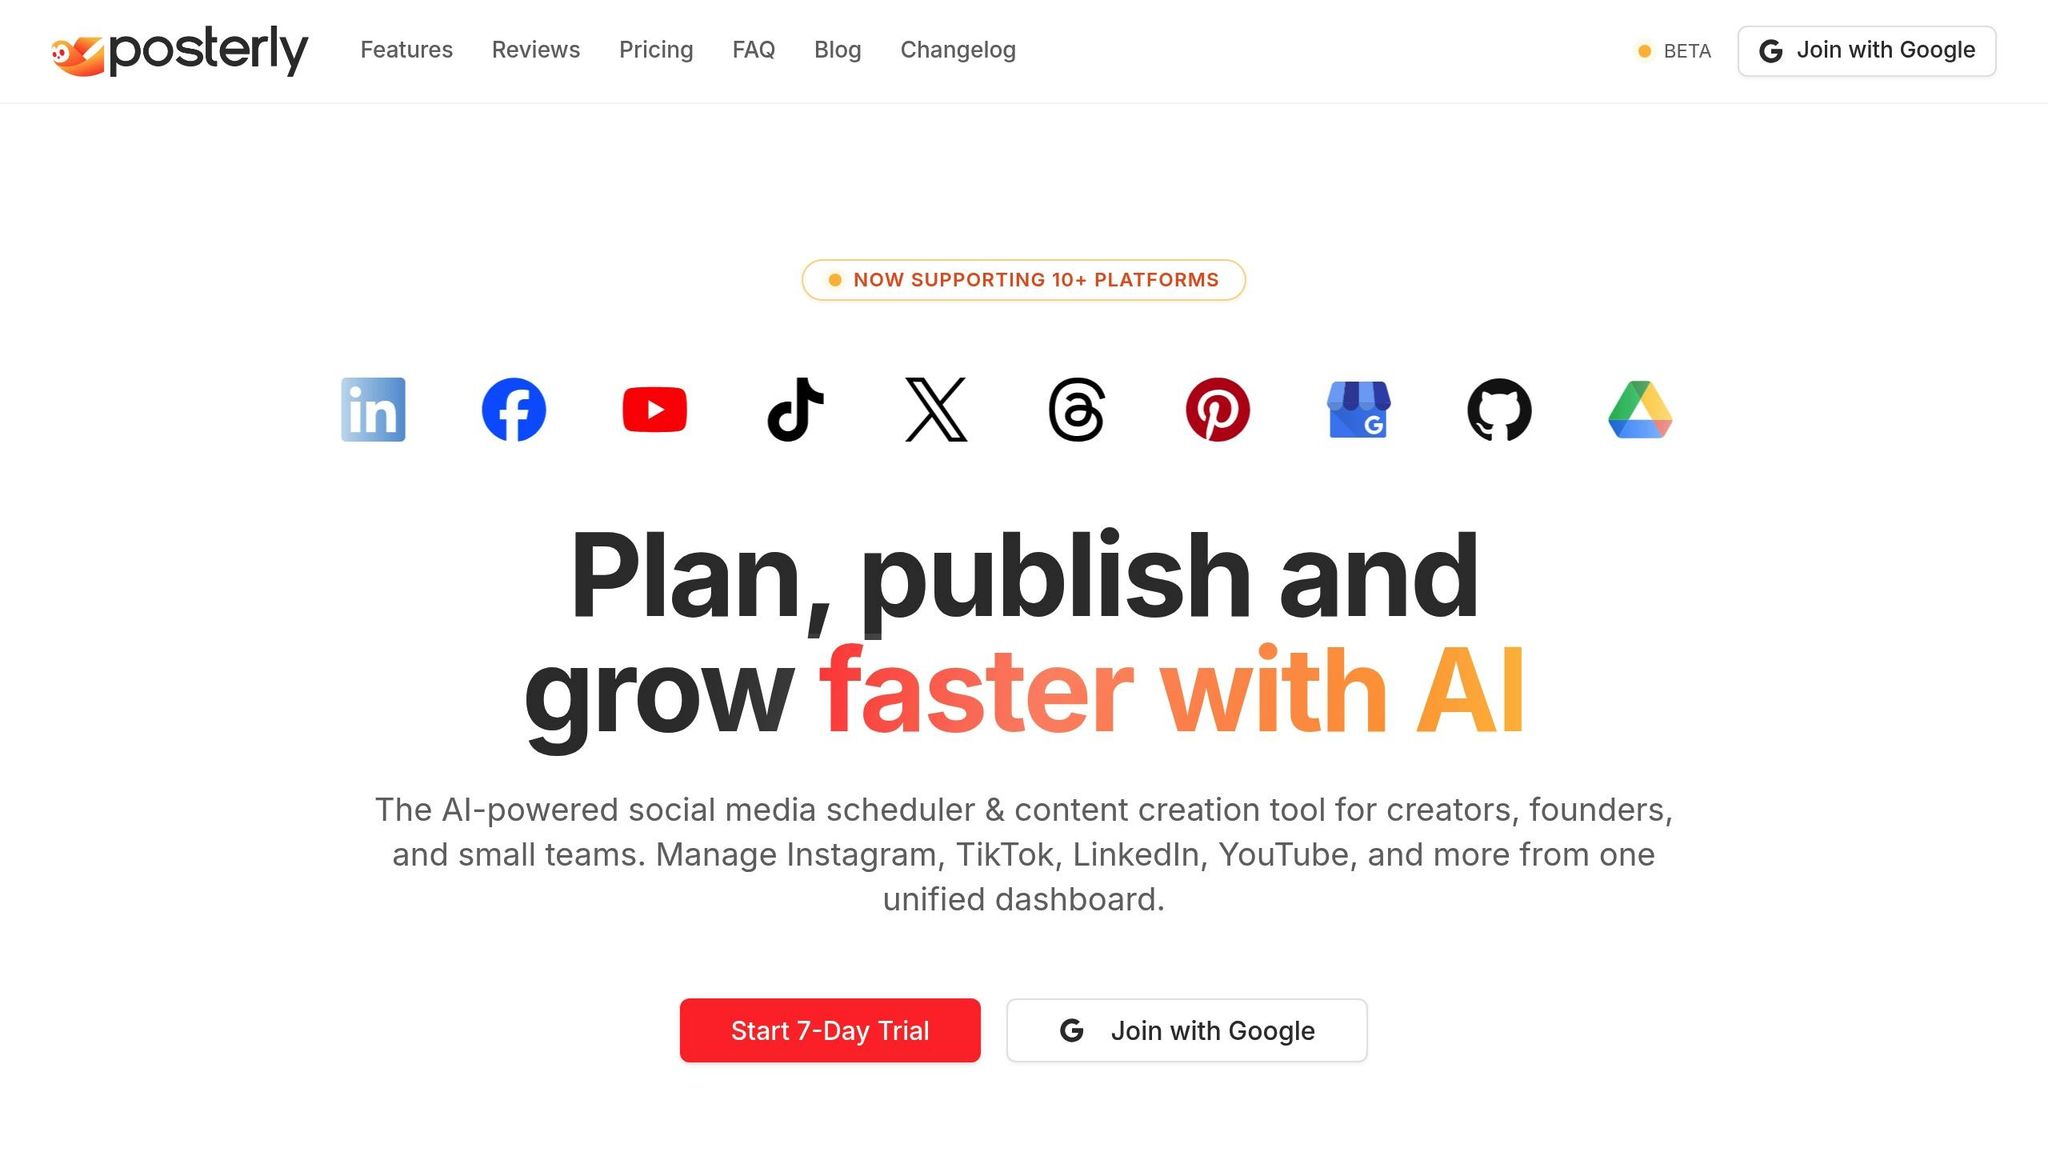
Head to the Social Accounts section in Posterly to view the supported platforms. These include popular options like Facebook, Instagram, LinkedIn, X (Twitter), TikTok, YouTube, Pinterest, Telegram, Threads, Bluesky, and Google Business Profile. Simply click on a platform to start the secure authorisation process. Make sure to accept all permissions during this step - especially for Facebook and Instagram - since skipping any could disrupt analytics or scheduled posts.
Each platform has specific access requirements. For instance:
- Facebook Pages: Admin status is needed.
- LinkedIn Company Pages: Super Admin access is required.
- YouTube Channels: Manager or Owner permissions are necessary.
For Instagram, ensure you're using a Professional or Business account, as personal profiles aren’t supported. Posterly already serves over 55,513 creators and teams, many of whom report engagement increases ranging from 26% to 36% after connecting their accounts [10][11].
If you manage multiple accounts on the same platform, open each one in a separate browser tab before starting the connection process. This avoids session conflicts. Most access tokens remain valid for 60 days, and Posterly’s advanced token management system automatically refreshes tokens as long as you publish at least once every six weeks [10].
Should you encounter any connection issues, try clearing your browser cache or switching to incognito mode. Be cautious: disconnecting an account with active scheduled posts will result in those posts failing permanently.
Step 3: Design Your Dashboard Layout
Once you've integrated your accounts, the next move is to organise your metrics in a way that makes them easy to interpret and act on. Your dashboard should mirror your workflow, ensuring that the most important data is always within reach. With Posterly's all-in-one command centre, managing multiple social channels becomes seamless - all from one view [1]. Use your integrated data to craft a layout that helps you access and understand key metrics effortlessly.
You can toggle between calendar, list, and table views to find the format that works best for your needs [1]. For instance, the calendar view is perfect for quickly identifying content gaps, while the list view lets you dive into the details of individual posts. If you’re comparing specific numbers across accounts, the table view offers the precision you need [5].
Add Widgets for Your Metrics
Make sure your most important widgets take centre stage. If engagement rate is a key focus, place it prominently on the dashboard rather than hiding it beneath follower counts. Posterly’s drag-and-drop feature within the calendar view makes it easy to reschedule posts across more than 10 platforms [1].
Use a mix of visualisation types to get the most out of your data. For example, charts are great for spotting trends like engagement spikes at specific times, while tables are better suited for detailed comparisons and sorting metrics across accounts [5]. To keep everything clear, ensure each widget includes a descriptive title and a defined date range so anyone viewing the dashboard knows exactly what they’re looking at [3].
Create Separate Views by Campaign or Platform
Avoid overwhelming your dashboard with too much data by creating separate views for different platforms, campaigns, or themes [1]. For instance, if you're running a product launch campaign alongside evergreen content, set up distinct views for each. This keeps your workflow organised and prevents unrelated data from getting mixed together.
Customise your dashboard based on who will be using it. For example, executives might need high-level summaries focused on ROI and strategy, while your execution teams will need detailed insights into post-level performance and tactics [3]. You can also use features like Smart Post Groups or labels to automatically track posts by campaign tags or content type - saving you time and effort [5].
To stay on top of your data, organic teams should check their dashboards two to three times a week to fine-tune content, while paid social teams should monitor theirs daily to track spend and conversions [5].
With a well-organised layout, you're ready to choose the best visualisations to represent your data effectively.
sbb-itb-f7b3a33
Step 4: Choose the Right Data Visualisations
When presenting data, the goal is to make insights instantly clear, saving time and effort. For tracking trends over time - like follower growth or engagement rates - line charts work perfectly. They help you identify patterns, such as a spike in engagement after a campaign or a drop during less active periods [13].
If you're comparing performance across categories, bar charts are your go-to. They make it easy to see which platform generates the most engagement or whether video posts outperform static images [13]. For illustrating proportions, such as audience demographics or your brand's share of voice, pie charts are effective - just keep them simple with no more than three segments [14].
Funnel charts are great for visualising conversions, showing how many users progress from initial interaction to final purchase [13]. For cumulative metrics like total reach or impressions, area charts provide a clear snapshot of volume and trends [13]. And when precision is key, tables offer a straightforward way to present detailed data, such as a list of your top-performing posts [14].
To make your visualisations even more effective, label each chart with a title, date range, and brief annotations. For example, note sudden spikes or dips and explain them - perhaps a viral post or an algorithm update caused the change [3].
Be mindful of accessibility when choosing colours. Avoid red-green combinations, as around 8% of users have colour vision deficiencies. Instead, use high-contrast, colourblind-friendly palettes like blue-orange or blue-yellow [13]. And since many people access dashboards on mobile devices, design your visuals with a vertical layout to ensure they remain easy to read on smaller screens [8].
Once you've chosen the right visualisations, you're ready to automate updates and share your dashboard effectively.
Step 5: Automate Updates and Share Your Dashboard
Set Up Auto-Refresh and Scheduled Reports
Once your custom dashboard is ready, the next step is automating updates to save time and ensure accuracy. Manually pulling data for reports can be a huge time drain, with teams often spending hours on this task [4]. Instead, connect your social media platforms through official APIs to enable automatic data syncing. This eliminates the need for exporting spreadsheets manually [4][10].
To keep your dashboard current, schedule automatic refreshes. For fast-moving campaigns like paid ads, hourly updates can help you catch budget issues early and adjust spending before resources are wasted [4]. For broader performance tracking, a daily refresh schedule is usually sufficient.
If you're using Posterly, link your accounts directly through the platform's unified dashboard. Make sure to check all the necessary permission boxes during the authorisation process - missing even one could disrupt the automated data sync [10]. Once connected, you can schedule recurring reports to be sent via email on a daily, weekly, or monthly basis. This keeps your team updated without requiring manual input [4][16][17].
"Reports that used to take hours now only take about 30 minutes. We're reporting for significantly more clients, even though it is only being handled by a single person. That's been huge for us." – Shayna Tyler, Analyst, Signal Theory Inc. [4]
Additionally, set up anomaly alerts to notify you when key metrics hit critical thresholds. For instance, you might want to know immediately if there's a sudden drop in ROAS or a spike in negative sentiment [4][17]. These alerts allow you to respond quickly to issues without constantly monitoring the dashboard.
Update Your Dashboard Based on Results
A dashboard is not a "set it and forget it" tool - it needs to adapt as your objectives evolve [2]. Regularly update it by using edit mode to rearrange or replace widgets, ensuring it focuses on the metrics that drive decisions [12][19].
To manage multiple campaigns or clients, duplicate your dashboard and customise the copies. For example, executives might need a high-level overview of ROI, while team members benefit from detailed post-level data [18][19][2][3]. Add comparison metrics to your widgets so you can instantly see how current performance stacks up against previous periods [18][2].
Make it a habit to review your dashboard weekly. This helps you spot trends, like which content formats consistently perform well or which strategies aren’t delivering results. Underperforming posts can highlight areas to either discontinue or rework entirely [3]. Use these insights to fine-tune your strategy and keep improving over time.
Conclusion
A custom dashboard brings all your data together in one place, focusing on actionable metrics like ROI, lead generation, and conversion rates instead of less meaningful statistics [4][15].
By automating reporting, you can save up to 75–80% of the time previously spent on manual data collection [4].
Posterly simplifies workflows by integrating over 10 platforms - such as Instagram, TikTok, LinkedIn, and YouTube - into a single, user-friendly dashboard. It allows you to monitor engagement, reach, and follower growth in real time, organise campaigns, and export analytics as CSV files or branded PDFs for stakeholder presentations [20]. With tools like AI Caption Assist and automated scheduling, users typically save more than 10 hours per week and see a 12% increase in engagement [21]. These strategies help streamline your data and empower smarter, more effective campaign decisions.
FAQs
::: faq
How can I select the best metrics to track my social media goals?
To choose the right metrics for your social media goals, start by clearly defining what you want to achieve. Are you aiming to increase brand awareness, boost engagement, or drive website traffic? Your objectives will guide which metrics to prioritise.
For instance, if your focus is on brand awareness, keep an eye on reach and impressions. On the other hand, engagement-focused goals should highlight metrics like likes, comments, shares, and click-through rates.
Select metrics that directly reflect your progress. For example, track follower growth if you're working on audience expansion or monitor website visits generated from social media to measure traffic. Make it a habit to review these metrics regularly to ensure they stay relevant and actionable. This allows you to tweak your strategy as needed and achieve measurable outcomes.
By aligning your metrics with your goals, you can use data to fine-tune your social media efforts and better support your broader business objectives. :::
::: faq
How can I securely connect my social media accounts to Posterly?
To securely link your social media accounts to Posterly, here’s what you need to do:
- Navigate to the Social Accounts section in the Posterly dashboard.
- Choose the platform you want to connect, like Instagram, TikTok, or LinkedIn.
- Make sure you're logged into the respective social media account on the same device.
- Use the platform's official API to authorise the connection, ensuring a secure and compliant process.
- Approve any necessary permissions, such as admin rights or profile access, to enable content scheduling and management.
For added security, it’s a good idea to reconnect your accounts from time to time - especially after any password updates or account resets. Posterly relies on official APIs to keep your data secure and aligned with platform rules. :::
::: faq
How can I automate updates and reports for my social media dashboard?
Automating updates and reports for your social media dashboard in Posterly is both straightforward and time-saving. With features like API integrations, webhooks, and scheduling tools, keeping your dashboard updated no longer requires manual intervention.
The Posterly API allows you to pull real-time data directly into your dashboard, ensuring it stays current. Webhooks, on the other hand, can trigger updates automatically whenever new posts go live or analytics are refreshed. Prefer scheduled updates? You can set up regular exports - like CSV or PDF files - so your reports are always ready when you need them. For those who prefer no-code solutions, platforms like Zapier or Make can seamlessly connect Posterly to your data sources, simplifying the entire process.
With these tools in place, your dashboard will always provide timely insights, letting you concentrate on achieving your social media objectives. :::
Related Articles
How to Create 30 Days of Social Media Content Using AI Images in posterly
A practical guide to generating a full month of original social media images with posterly's AI image tool, writing captions for each one, and scheduling everything in a single session.
Read moreHow to Find the Best Time to Post on Social Media Using posterly's AI Scheduler
Stop guessing when to post. This guide explains how posterly's AI Scheduler analyses your audience activity and automatically picks the best posting times so your content gets seen by more people.
Read moreHow to Manage Google Business Reviews on Autopilot With posterly
A step-by-step guide to responding to Google reviews with AI, automatically requesting new reviews from customers, auditing your profile for local SEO, and turning your best reviews into social media content.
Read moreHow to Manage Multiple Client Social Media Accounts With posterly Workspaces
A practical guide for agencies and teams on using posterly Workspaces to organise client accounts, assign roles, get content approved, and schedule posts across dozens of social profiles without things getting messy.
Read more